

Who doesn’t love a good statistic? It’s even better when they are taxation statistics.
Each year the Australian Tax Office publishes an annual report on taxation statistics that provide valuable information about the financial state of our country. The recent publication of statistics look at the tax returns and related schedules that have been lodged by taxpayers for the 2016–17 income year for all individuals, companies, superannuation (super) funds, partnerships and trusts.
There are many fascinating trends that are revealed each year from these reports, and the volume of information compiled is enormous. The full list of statistics is available here for everyone to review.
Below is a very small selection of the statistics that you may find interesting.
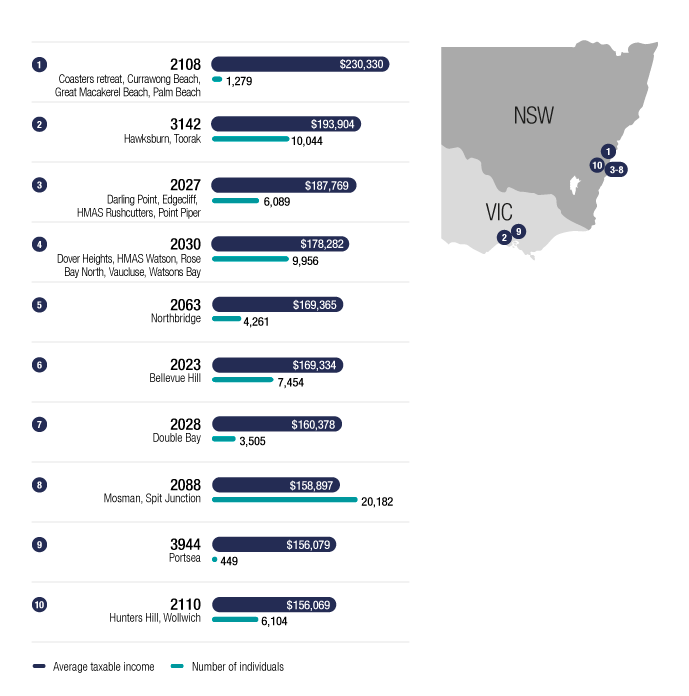
What were the top 10 postcodes by average taxable income for Individual Tax Payers?
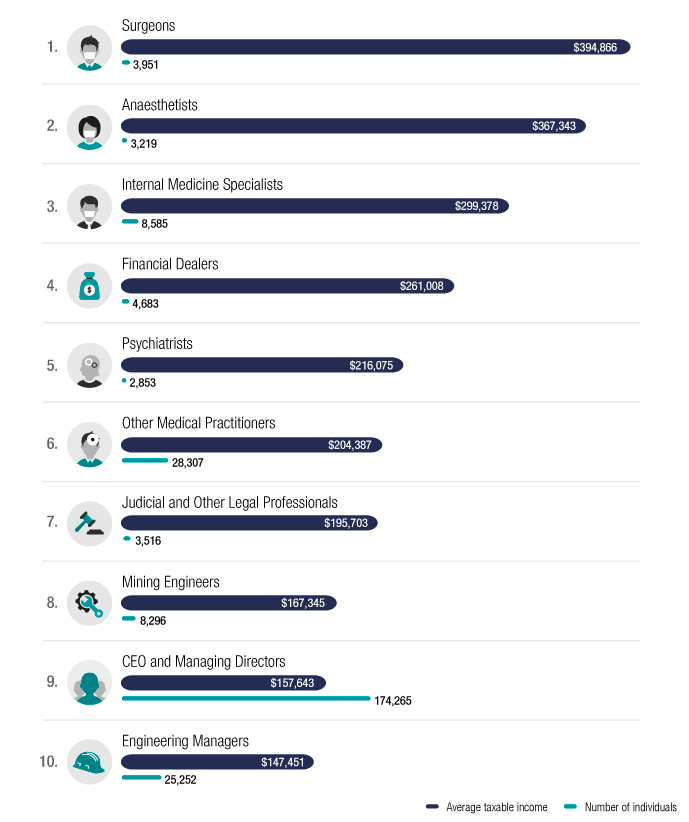
What were the top 10 occupations, by average taxable income?
What were the percentage of individuals and net tax, by tax bracket, 2016–17 income year?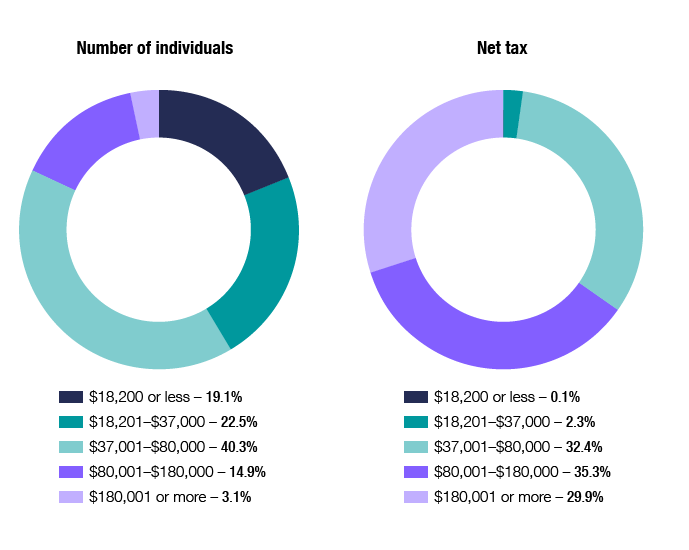
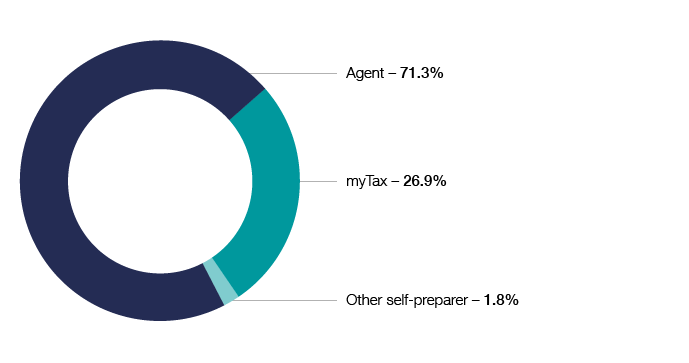
How did Individual Taxpayers lodge their 2017 tax returns?
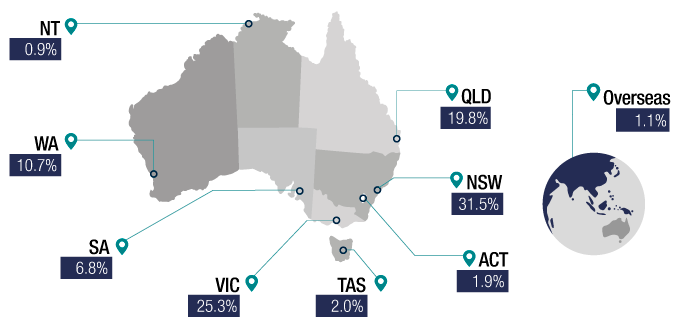
What was the percentage of individual returns lodged per State and Territory?
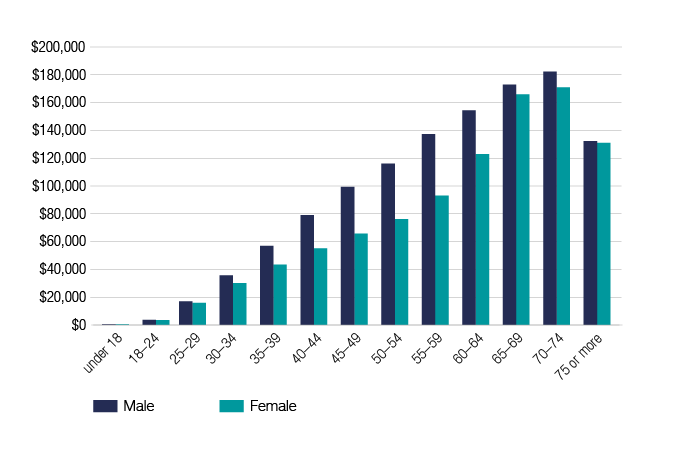
What was the Median superannuation fund balance, by age and sex, 2016–17 financial year?
People statistics – key data represented as 100 people
There were 13.9 million individuals who lodged tax returns to the ATO for the 2016–17 income year. For these statistics below, each number represents a percentage of total returns lodged.
- 51% of tax returns lodged were from males and 49% of tax returns lodged were from females.
People lodged their tax returns from all over Australia:
- 31% from New South Wales
- 25% from Victoria
- 20% from Queensland
- 11% from Western Australia
- 7% from South Australia
- 2% from Tasmania
- 2% from the Australian Capital Territory
- 1% from the Northern Territory
- 1% from overseas or an unknown address.
Tax returns were from five different generations:
- 20% from generation Z
- 26% from generation Y
- 27% from generation X
- 22% from baby boomers
- 5% from the silent generation.
People lodged their tax returns in different ways:
- 71% through a tax agent
- 27% using myTax
- 2% by paper.
The ATO received tax returns from people in all sorts of occupations:
- 23% were blue collar workers
- 39% were white-collar workers
- 16% came from the service sector
- 22% didn’t specify their occupation or had no occupation.
33% of people donated to charities and then claimed deductions.
5% of people declared capital gains.
64% of people claimed work-related expenses, of whom:
- 20% claimed under $500
- 10% claimed between $500 and $1,000
- 34% claimed over $1,000.
16% of people earned rental income, of whom:
- 10% had a net rental loss
- 6% had a net rental profit.
After the tax returns were assessed:
- 78% of people received a refund
- 15% of people owed tax
- 7% balanced perfectly.
9% of people operated a business in their own name of whom:
- 2% made a loss
- 7% made a profit.
If all people were ranked out of 100 by their taxable incomes:
- people with the 3 top taxable incomes paid 30% of all net tax
- the next 6 paid 18% of all net tax
- the next 30 paid 40% of all net tax
- the next 36 paid 12% of all net tax
- the last 25 didn’t pay any tax.
For more information on what these taxation statistics might mean for you please feel free to contact us and join the conversation…